


Mizube Go!

Survey the waterfront*1 with just a smartphone.
See it, feel it, touch it.
Using the app, users can survey the waterfront and learn how to "understand the waterfront" by simply answering questions from five perspectives (the five perspectives are based on the Water Environmental Soundness Index*2 developed by the Ministry of the Environment).
Research records will be an important resource.
Let's inherit today's good waterfront for future!
The collected waterfront data (survey results, photos, and comments) will be archived and serve as a useful reference for waterfront development (environmental planning and disaster prevention/mitigation planning).
*1 "Waterfront" refers to places with water, such as rivers, lakes, ponds, and
swamps. Oceans and artificial ponds are not included.
*2 For more information on the "Water Environmental Soundness Index", please visit
Japan Society on Water Environment.
Features of Mizube Go!

Everyone is welcome to join!
The world's first! This is an application to collect data only on water bodies (rivers, lakes, ponds). Let's investigate your favorite waterfront.

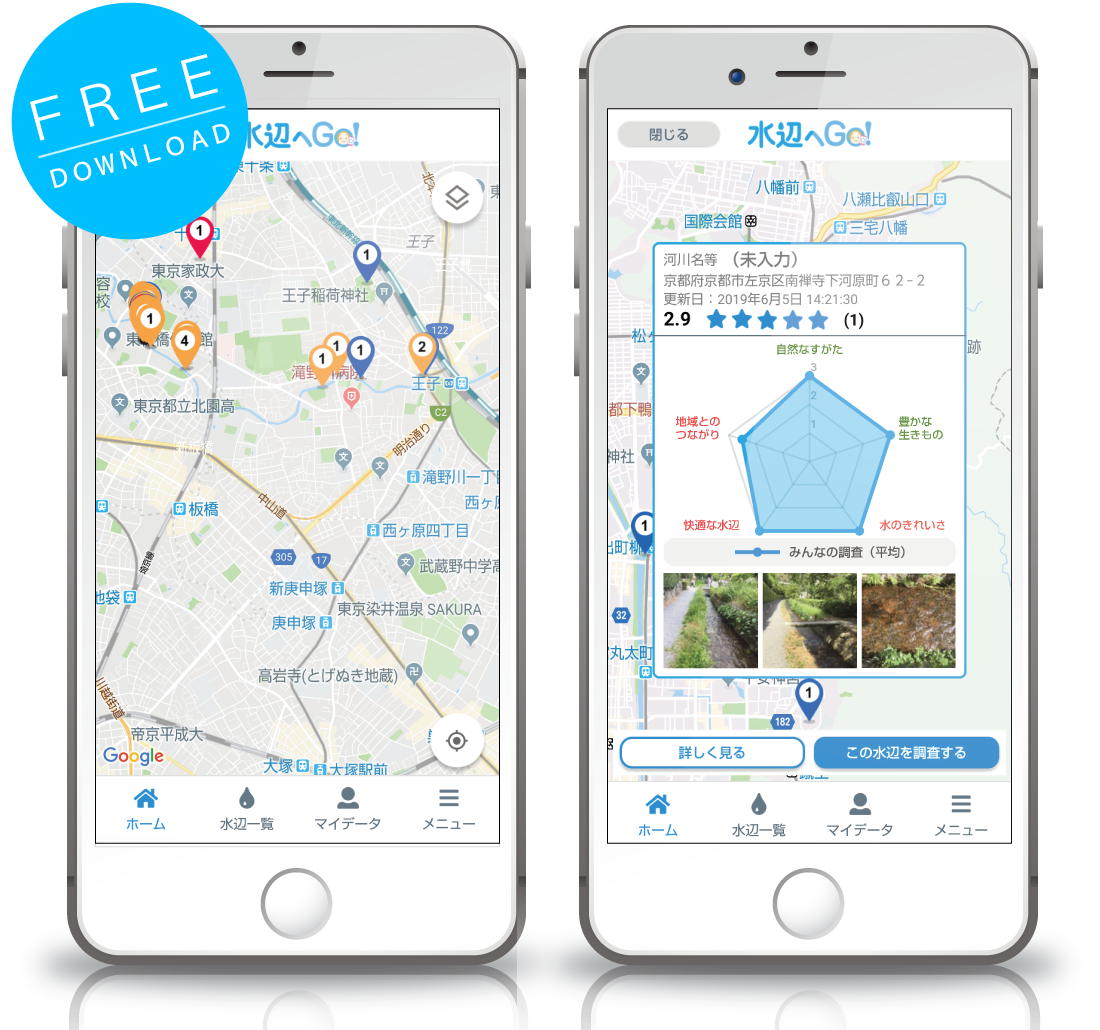
Visualization of survey results
The colors of the waterfront spots on the map, the shape of the radar chart, and the photos will help you visually understand the health of the waterfront.

Sharing of waterfront data
You can see the waterfront in Japan and around the world that people have researched. You can also collect your own waterfront data in "My Data".
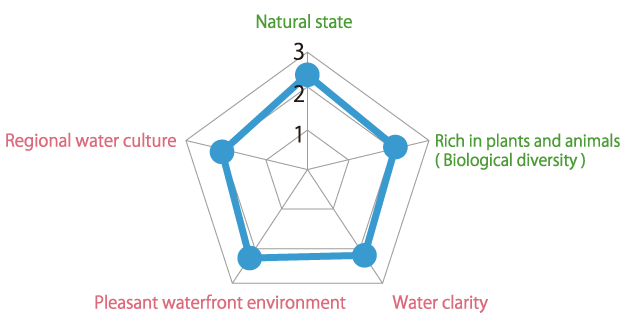
What is the Water Environment Soundness Index (WESI)?
The WESI is an indicator system that shows how rivers and other water bodies should be understood, and is composed of five perspectives. The "Natural state" and "Rich in plants and animals (Biological diversity)" represent the natural environment (green), while "Water clarity", "Pleasant waterfront environment" and "Regional water culture" represent human activities (pink). It is important to have a good balance between these two.
The average score of each viewpoint is represented on a pentagonal radar chart, and the larger the pentagon shape and the closer it is to a regular pentagon, the healthier the waterfront is.
News
2025.12.10Report
2024.03.25Report
2021.07.15Info
We have released an English version site.
Start "Mizube Go!" now!


Contact Us
Please feel free to contact us if you have any questions about how to use "Mizube Go!" or how to use it for environmental learning.